Disclaimer
I am not an economist. This is not advice. I am just a guy trying to buy a house.
Average House Price
I started looking at house prices in Feb 2020 for fun since at that time I had just started my career and moved into the big city in Texas. It is now June 2023 (3.5 years later) and I have seen house prices sky rocket. I wanted to look to see if this was normal so I started looking into it.
CSHPI
I will be using the Case-Shiller Home Price Index (CSHPI) for creating a normalized average house price comparison. "The Case-Shiller Home Price Index is a widely recognized measure of the price level of existing single-family homes in the United States. Developed by Robert J. Shiller and Karl E. Case, it is considered the leading indicator of US residential real estate prices. The index is based on a scale of Jan 2000=100 and is multiplied by 1800 to approximate the average sales price of houses sold in the United States."[1]
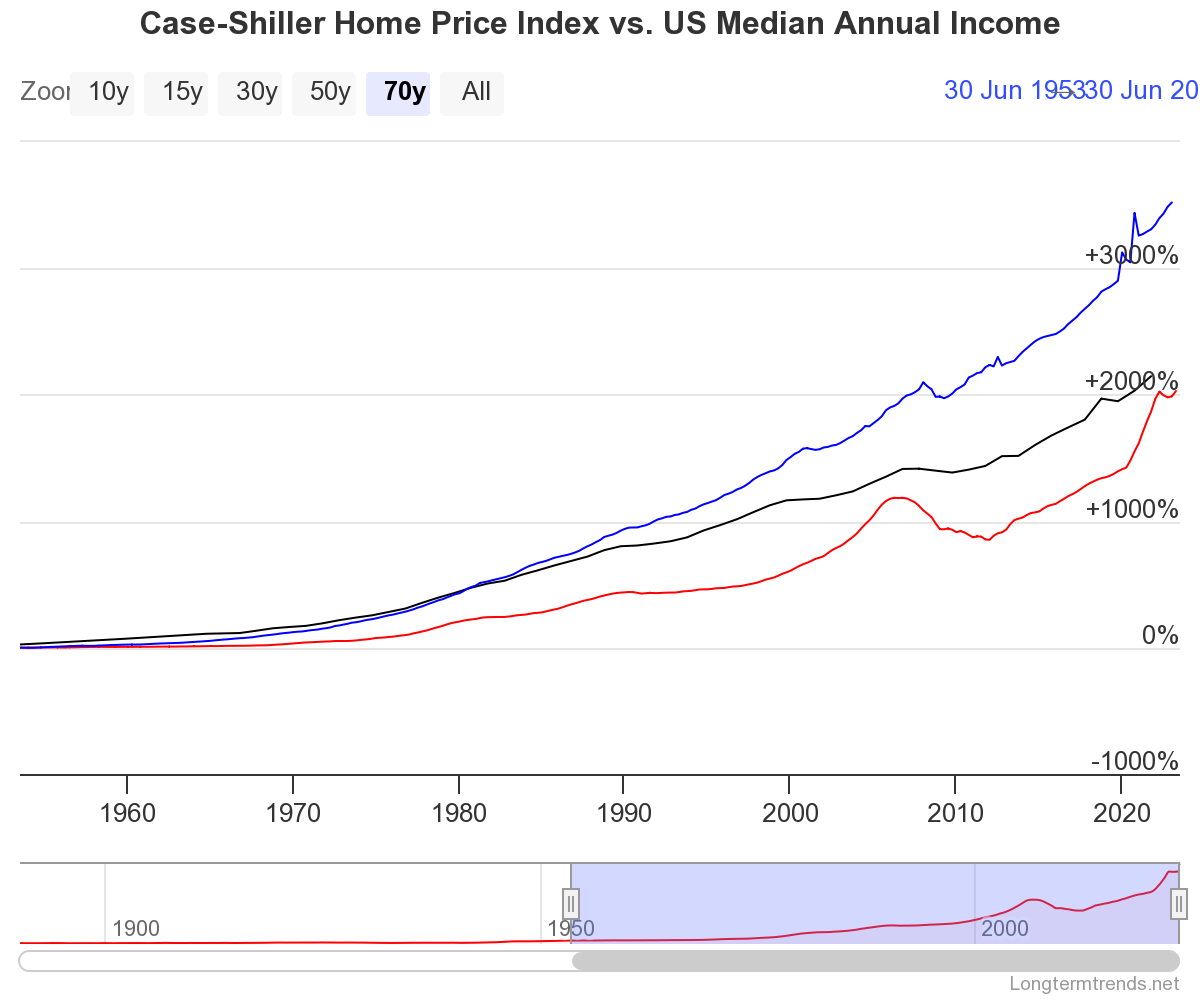
🟥 RED: Case-Shiller Home Price Index (multiplied by 1800). ⬛ BLACK: Median Household Income in the US. 🟦 BLUE: Personal Average Income in the US
Okay, if we were to follow out our example, the CSHPI in Feb. 2020 is 389,370.6 and today (June 2023) it is 552,096.0. That is a 41.79% increase since Feb. 2020. Wow, maybe thats just due to inflation?
Compared to personal income
Let's say I have been working with no pay increases and my income has only rose with inflation. I am going to use the CPI to evaluate the value of the USD over time. "The Consumer Price Index (CPI) is a measure of the average change over time in the prices paid by urban consumers for a market basket of consumer goods and services" [2]
Using the Inflation Calculator from the U.S. Bureau of Labor Statistics, from Feb. 2020 to June 2023, the value has increased 17.95%
If average house price increased by 41.79% and my income only increased by 17.95%, it was was easier to buy a house in 2020.
Inflation vs Pay Raise
Lets say I got paid $50,000 in Feb 2020. In this scenario, I would be working for almost 3.5 years and now lets say I get paid $58,000. (averaging a $2,000 bump each year. Not bad!). If I we were to adjust my initial income ($50,000) to todays (Aug. 2023) dollars, it would be worth $57,826.72 (15.65% increase) (assuming my pay increases happened in January). I only got a $173 pay raise over the total time working when adjusted for inflation.
Extrapolating further, if I look at today (June 2023), the inflation adjusted value of my initial income is $58,974.67 (which is about a 17.95% increase). I would make less money than day 1 of working! [3]
Other Metrics
Since these are normalize US index, I am not the only one in this (sinking) boat. The Longtermtrends site has another chart that looks at the ratio of the Home Price to the Median Household Income Ratio over time.
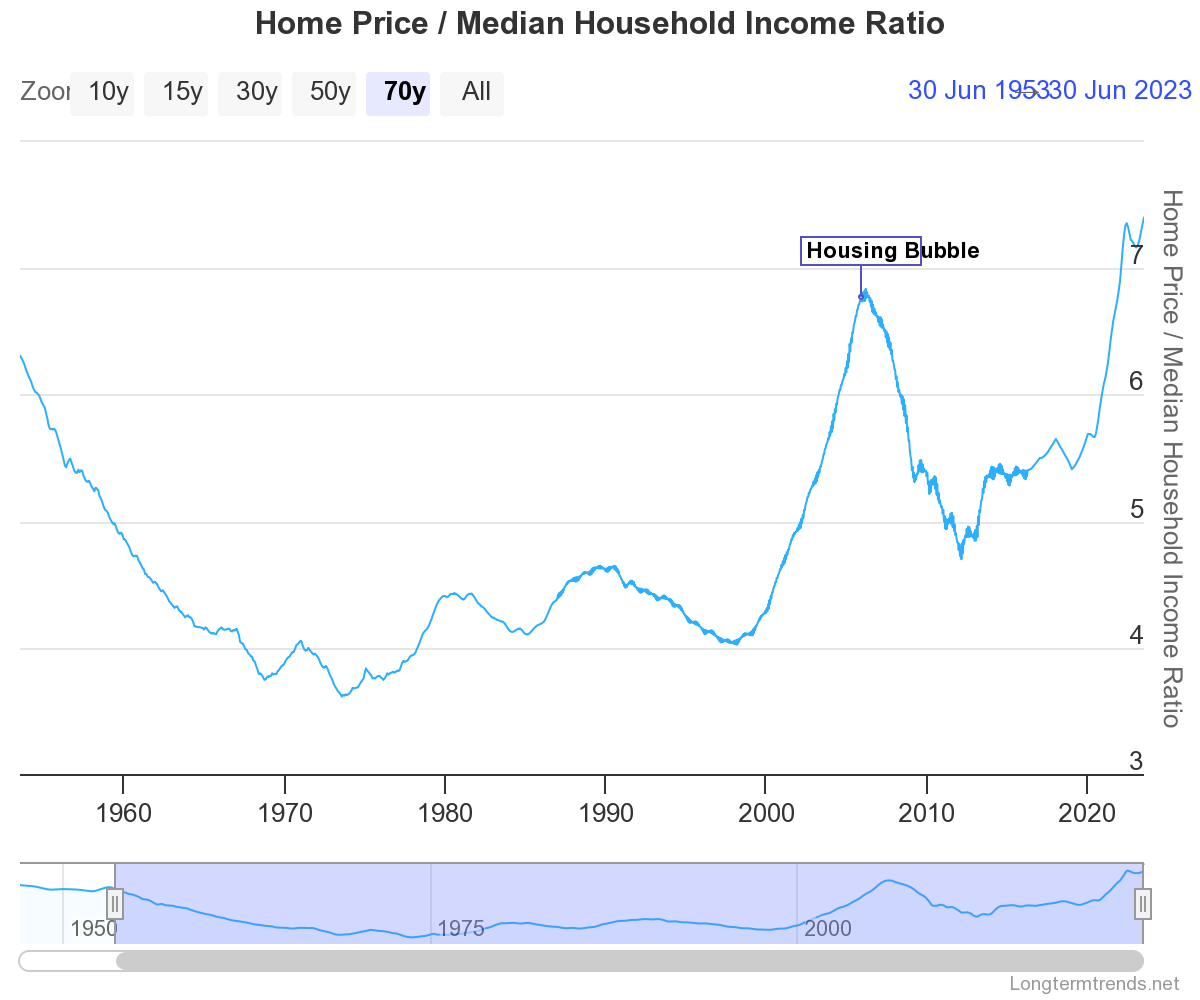
Longtermtrends - Home Price to the Median Household Income Ratio
Wait, does that say Housing Bubble? THE 2008 Housing Bubble? The ratio of income to house prices is worse today than the infamous 2007-2008 financial crisis. If that is not a bad sign, I don't know wat is. (The Big Short Is a great dramatized movie about the actions leading up to this event)
Lets pull up a random house. They all show the same thing. The "Zestimate" price has almost doubled since 2020
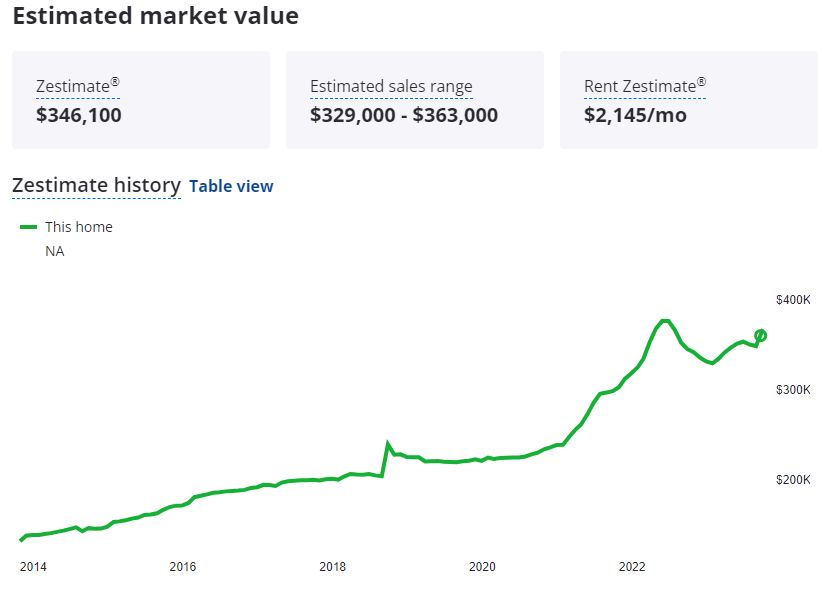
Random House #1 near me price over time
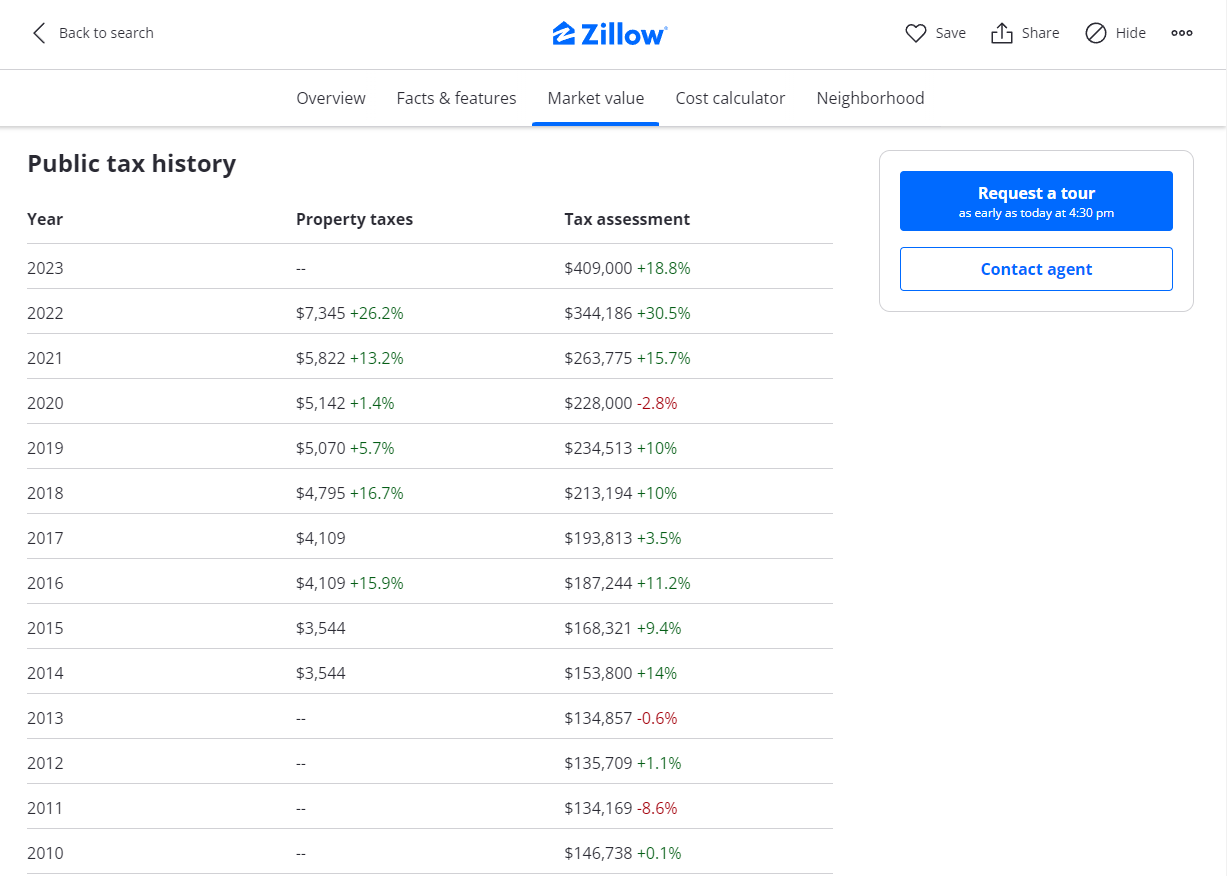
Random House #2 near me public taxes over time
Mortgage Rate
All of this doesn't even mention interest rates. The interest rates in Texas are also at an all time high
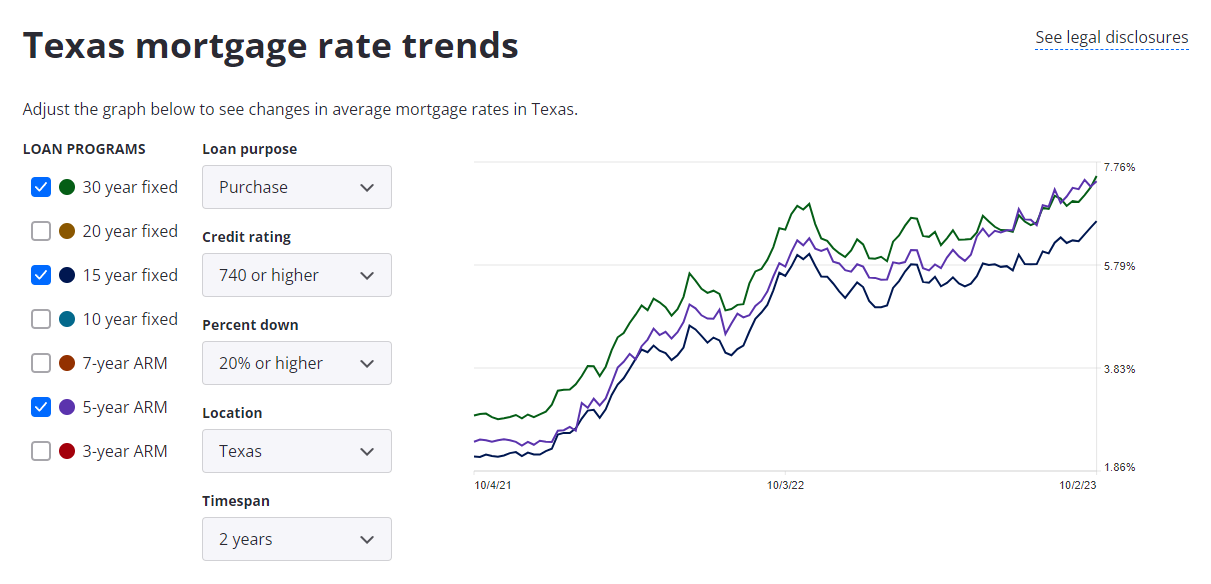
Texas Mortgage Rates according to Zillow[4]
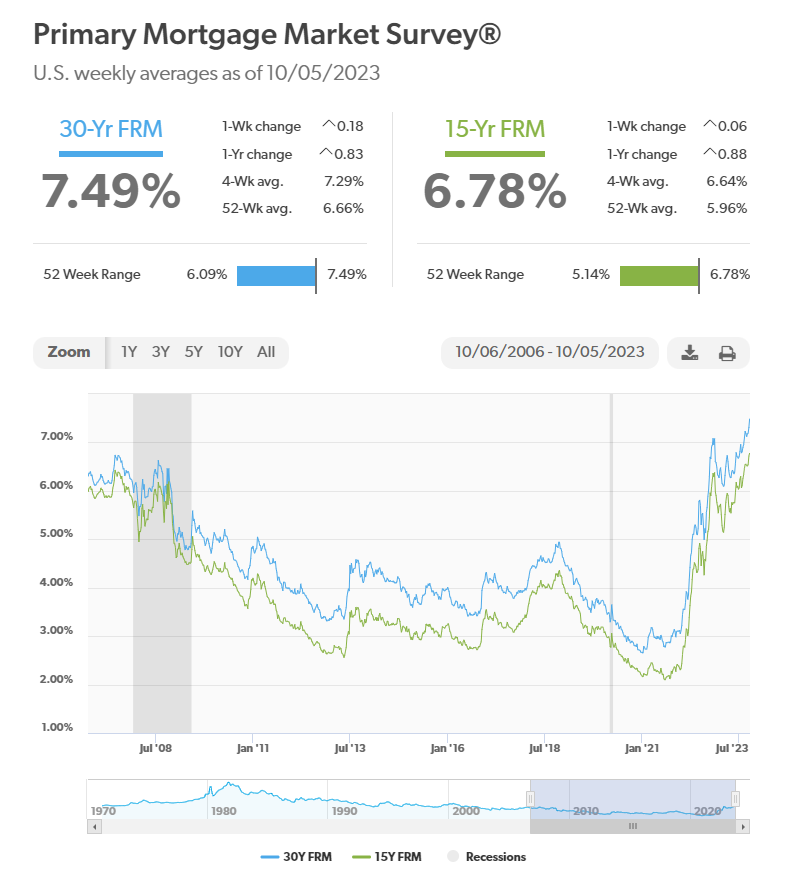
Freddie Mac - Primary Mortgage Market Survey[5]
Summary
I am kicking myself for not buying a house earlier. What can ya do I guess.